
Breaking Waves
John Reid
Surface gravity waves (e.g. ocean waves) have an interesting property. They are “dispersive”. This means that the group velocity (the speed of a “set” of waves) is exactly half of the phase velocity (the speed of an individual wave as it moves through the set). Both of these velocities depend on wavelength; the longer the wavelength, the faster the wave speed. Thus when swells from distant storms arrive at a coastline the longest waves travel fastest and arrive first. This is why swells shorten over time.
Waves slow down when the water becomes shallower. When they slow down they become shorter and steeper because the same amount of wave energy is contained in a shorter length interval just as cars cluster together on a freeway when the traffic stream slows down. When waves reach a certain critical steepness (wave height = wavelength / 7 approximately) they break.
Waves also break in the open ocean away from the shore. This is called “whitecapping” and characterises “wind seas” as distinct from swells.
All this has been known for centuries. However there are some aspects of waves which are still not well understood. Chief among these is frequency downshifting., i.e. the way in which wind waves become longer in wavelength and lower in frequency with increasing fetch. The “fetch” is the distance over water that the wind has been blowing.
A modest experiment, completed in a single day using the Australian Maritime College towing tank, provided some insights into frequency down-shifting and the evolution of wind-waves.
 The AMC Towing Tank
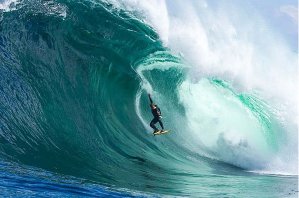
What happens when waves break.
1. Introduction
Fluid dynamics starts with the assumption that any fluid is a continuum, i.e. smooth at any scale. This assumption and the conservation of mass leads to the basic equations of fluid dynamics, the Navier-Stokes equations, which are partial differential equations in which the variables, pressure and velocity are continuous functions representing random numbers. Differential equations like the Navier-Stokes equations are deterministic, i.e. if the state of the system is known at any moment, then it’s state at any future time can be determined. There is no room for chance.
It has been known for well over a century that this assumption is not correct. The observation of the Brownian Motion alone is sufficient to support the atomic theory and so disprove the continuum assumption. Other branches of physics such as thermodynamics, statistical physics and quantum physics have learned how to deal with random behaviour, but not as yet fluid dynamics.
To date the Navier-Stokes equations are all we have to work with. They work very well for low Reynolds Number (streamline) flows, but problems arise when turbulent phenomena are encountered. Turbulence is primarily a stochasticstic phenomenon, i.e. random, governed by the laws of probability.
The Navier-Stokes equations cannot allow for increased entropy implicit in turbulent flow.
Wave breaking involves turbulence. While fluid mechanics can predict when waves break, what happens after waves break is beyond our ken. In numerical wave models, wave breaking is parametrized using some crude rule of thumb such as the dubious assumption of a fifth power roll-off with frequency.
In the absence of a comprehensive theory to cover wave breaking all we can do is to closely observe what happens in the real world and, hopefully, extend theory on this basis. This simple experiment is a first step in that direction.
2. An experimental physics approach to wave breaking
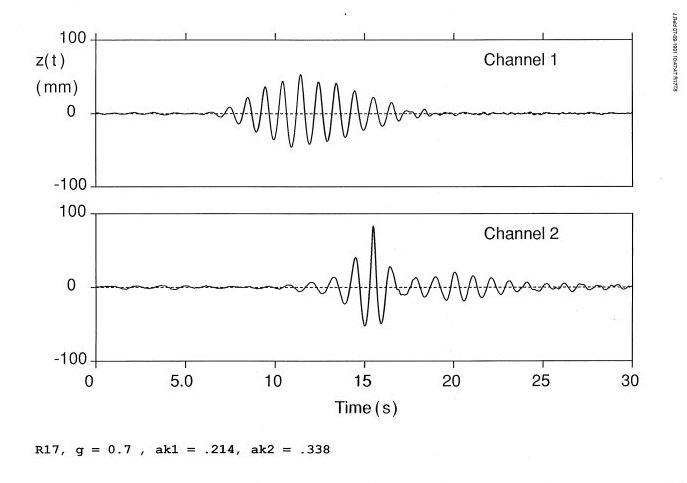
The 60m long towing tank at the Australian Maritime College was used to carry out an experiment. The towing tank had an hydraulically controlled paddle driven by a small computer which could be programmed to generate any wave shape. Wave groups comprising 12 or so sinusoidal waves with a raised cosine envelope were generated by the paddle and allowed to propagate down the tank. Only the amplitude was changed from group to group. As the group travelled down the tank individual waves were observed to move from the rear of the group to the front demonstrating that phase velocity is indeed greater than group velocity. The envelope of each group changed shape dramatically as can be seen in the diagram at the top of this page.
When the amplitude was set to larger values, wave breaking (i.e. white-capping) occurred. Individual waves broke as they passed through the center of the envelope, i.e. when they were at their steepest.
Wave breaking had little effect on the shape of the wave group. The changing shape of the envelope appears to be due to the Benjamin-Feir sideband instability and was not affected by wave breaking. However wave breaking had an important effect on the frequency spectra of the downstream wave groups.
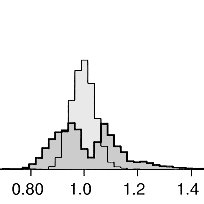
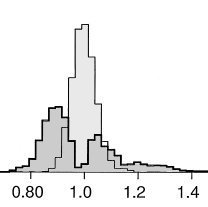
Figure 2. The images shows the “before” (light grey) and “after” (dark grey) frequency spectra for two groups with different amplitudes. The spectra of the time series of the diagram at the top of the page are shown on the right.
In both cases the spectra show that the original spectral peak has split into 2 sidebands in accordance with Benjamin-Feir theory. The downstream spectrum on the left has two approximately equal sidebands whereas the upper sideband of the downstream spectrum on the right is significantly smaller than the lower sideband. As a consequence, there was a net downward shift in frequency associated with wave breaking.
3. Frequency downshifting in the open ocean
When wind starts to blow across still water small ripples are first formed by the Kelvin-Helmholtz instability. The ripple wavelength remains the same until the wind is strong enough to generate waves large enough for the Benjamin-Feir instability and white-capping to occur. When this happens energy is lost from the high frequency sideband and there is a net downward shift in frequency and lengthening of the waves. These downshifted waves accumulate more energy by this process until they too break, giving rise to further down-shifting.
This hypothesis can be confirmed by anyone willing to patiently observe waves forming on a dock or canal on a windy day. Downshifting only occurs when the ripples start to break.
4. Conclusion
This simple experiment presents an exciting prospect. Much can still be learned experimentally about wave breaking and about the generation and non-linear interaction of solitons by performing similar experiments. There are many wave tanks around the world which could be used for this purpose in much the same way that physicists use particle accelerators to perform experiments in quantum mechanics. A whole new science of experimental non-linear surface gravity wave interactions could be opened up.
More importantly these observations provide a useful benchmark for developing a more general class of numerical fluid dynamical models in which increases in entropy are properly taken into account.
5. References
Reid, J.S. (1992) “The Sideband Instability and the Onset of Wave Breaking” in Breaking Waves IUTAM Symposium, Sydney Australia, 1992.
which is reproduced here: sidebandinstability.pdf