
Ocean mixing can absorb CO2
John Reid
James E. Lovelock and Chris G. Rapley proposed bringing nutrients, nitrate and phosphorus, found at depth, to the surface of the ocean in order to remove CO2 from the atmosphere by the ensuing photosynthesis ( ‘Ocean pipes could help the Earth to cure itself’, Nature, 449, 403; 2007). Their proposal was criticized on a number of grounds by John Shepherd, Debora Iglesias-Rodriguez and Andrew Yool ( ‘Geo-engineering might cause, not cure, problems’ Nature, 449, 781;2007). One criticism was that the scheme would bring water with high natural pCO2 levels (associated with the nutrients) back to the surface, potentially causing exhalation of CO2.
We show that this is not always the case and depends on the location. Their other criticisms were based on experiments with intermittent iron fertilization and do not apply to the continuous upwelling case. The difficulty with Lovelock and Rapley’s proposal is physical rather than chemical: where is the energy to be found to lift the colder denser water to the surface?
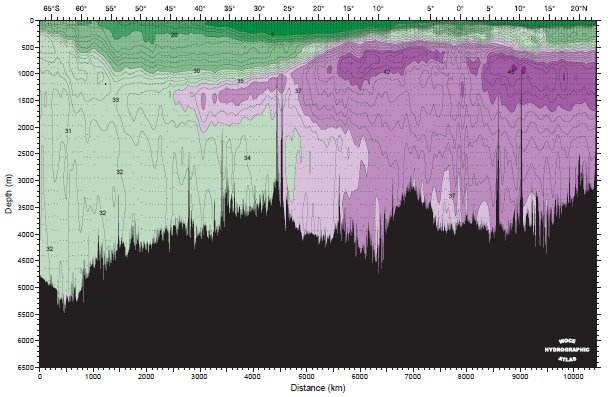
The physical chemistry of the interaction of carbon dioxide with seawater is complex but well understood, (see W. S. Broecker and T.-H. Peng Tracers in the Sea, Lamont Doherty Geophysical Observatory, 1982). Temperatures, salinities and concentrations of all of the major chemical components needed in the calculations can be downloaded from the WOCE Pacific Ocean Atlas .

| Location | Latitude | Longitude | Depth | WOCE Section |
|---|---|---|---|---|
| A | 15ºS | 105ºW | 800m | P18 |
| A | 40ºS | 105ºW | 1000m | P18 |
| A | 54ºN | 165ºW | 400m | P15 |
| A | 30ºS | 165ºW | 500m | P15 |
Four widely separated locations in the Pacific Ocean were chosen and are listed in Table 1. We calculated what would happen to alkalinity and total carbon content when a parcel of water from intermediate depth is brought to the surface at each of these locations. Graphs of the various quantities were downloaded in pdf form and values to be used were read from the graphs. These values are shown in Table 2, which shows the salinity in p.s.u. (practical salinity units) and concentrations of the other components, phosphorus, silicon, total alkalinity, At , total dissolved inorganic carbon, Ct and nitrate, Nt , at the locations listed in Table 1.
| Location | Salinity | Phosphorus | Silicon | Alkalinity | Carbon | Nitrate |
|---|---|---|---|---|---|---|
| A | 34.5 | 3.0 | 60 | 2320 | 2300 | 43 |
| B | 34.3 | 2.2 | 30 | 2295 | 2200 | 31 |
| C | 34.0 | 3.0 | 98 | 2320 | 2330 | 42 |
| D | 34.6 | 1.3 | 7 | 2290 | 2127 | 19 |
We assume that when the parcel of water reaches the surface phytoplankton will bloom and photosynthesis will remove all of the nitrate. This will bring about changes to the total alkalinity, and the total carbon concentration to yield new values A0 , and C0, according to the following formulae:
A0 = At + Nt (1)
and
C0 = Ct – 6.8Nt (2)
Equation (1) describes the increase in alkalinity brought about by photosynthesis and is derived from equation (2 – 25) of Broecker and Peng (loc. cit.); alkalinity increases according to the number of nitrate ions removed from solution. Equation (2) above describes the decrease in carbon brought about by photosynthesis. The factor of 6.8 is the Redfield ratio for carbon and nitrogen. Resulting values of A0 and C0 are listed in Table 3.
The total dissolved inorganic carbon, C380 , that can be held by the water mass at atmospheric partial pressure (380) depends on temperature and alkalinity and to a lesser extent on the other parameters listed in Table 1. This was calculated using the CO2sys program (see Lewis, E., and D. W. R. Wallace. 1998. Program Developed for CO2 System Calculations. ORNL/CDIAC-105. Carbon Dioxide Information Analysis Center, Oak Ridge National Laboratory, U.S. Department of Energy, Oak Ridge, Tennessee). The sequestration rate, i.e. the rate at which carbon is absorbed from the atmosphere by the water mass per kilogram of upwelled water, is given by
ΔC = C380 – C0 (3)
where negative values of imply that CO2 is exhaled to the atmosphere
We assume that the upwelled water mass soon acquires the local sea surface temperature (SST) and that its alkalinity will remain unchanged once the initial phytoplankton bloom has occurred. Using the WOCE values of SST and the computed alkalinity, values of C380 and ΔC were found and are listed in Table 3. Comparison of values of the sequestration rate, ΔC , for locations A, B and C indicate that it is positive and a strong function of local SST at the upwelling location. However comparison of between locations A and D, which have the same local SST, indicates that alkalinity is also a factor. C380 at location D is negative because the lower alkalinity and lower nitrate concentration of the upwelled water mass leads to net exhalation of CO2 to the atmosphere.
| Location | Alkalinity, A0 | D.I.C., C0 | S.S.T., (ºC) | Saturation, C380 | Difference, ΔC |
|---|---|---|---|---|---|
| A | 2363 | 2008 | 24 | 2031 | 23 |
| B | 2326 | 1989 | 15 | 2082 | 93 |
| C | 2362 | 2044 | 8 | 2171 | 127 |
| D | 2309 | 1998 | 24 | 1990 | -8 |
Thus upwelling can lead to carbon sequestration but only at locations where the nutrient concentration and alkalinity of the upwelled water are relatively high. Such locations can be found in most of the Pacific ocean north of the equator and as far south as latitude 30oS in the Western Pacific, an area of the earth’s surface larger than the continent of Asia.
The importance of alkalinity and nitrate concentration in these calculations implies that conclusions drawn from iron fertilization experiments do not apply to fertilization by upwelling as discussed here. High alkalinity and high nitrate concentration are both important in bringing about positive sequestration in regions where iron is not the limiting factor.
Another distinction from the iron fertilization experiments is that those experiments all involved a single one-off event which could not be tracked continuously for long periods of time owing to limitations on cruise time and ship availability. Artificial upwelling as discussed here involves an ongoing process which continues unabated until such time as the mechanism fails. In this way a large carbon-containing biomass will be built up until the export of carbon to the deep ocean in the form of faecal pellets and other detritus is equal to the total carbon input from the atmosphere and the up-welled water. Much of this carbon will be re-mineralized in the deep ocean where it will remain for a millennium or so. Even when it resurfaces the ratio of carbon to nitrate and phosphorus should remain in the Redfield ratio and renewed photosynthesis would ensure that there would be no net exhalation to the atmosphere.
A more cogent criticism of Lovelock and Rapley’s proposal is based on physical rather than chemical grounds. The peak in nutrient concentration occurs at depths of 1000m or so, rather than the 200m suggested by them. It seems unlikely that any scheme based on wave power alone could generate enough energy to raise water from these depths in sufficient quantity to be useful.
However an alternative scheme has been proposed by Ecofluidics Pty Ltd. A supply of carbon-neutral energy is available in the deep ocean in the form of superheated water released by hydrothermal vents found along volcanic arcs and mid-oceanic ridges. When such superheated water (typically at 360o C) is brought up to shallower depths (1100m), it is capable of moving much larger quantities of nutrient-rich water by entrainment into the plume of steam bubbles which will form when it boils. The density ratio of steam to the surrounding water mass is orders of magnitude larger than the density ratios within the water mass itself so that the flux “gain” in moving water upwards by this means is similarly large.
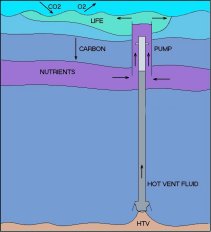
Only 20 percent of the world’s mid-oceanic ridges have been explored and wherever they have been explored vents have been found. It has been estimated that the total power released from mid-oceanic ridges is of the order of tens of terawatts, roughly equal to the total power consumption of mankind.
There is likely to be both sufficient hydrothermal power and sufficient nutrient available in the North Pacific alone to halt the present upward trends in atmospheric carbon and ocean acidification.
Acknowledgement: I would like to thank Ass. Prof Tom Trull of the Institute of Antarctic and Southern Ocean Studies, University of Tasmania for his helpful guidance about carbon chemistry. The author is a director of Ecofluidics Pty. Ltd.
Addendum: According to one expert on ocean CO2 uptake, IPCC contributor, Dr Richard Matear, Senior Research Scientist at Marine and Atmospheric Research, CSIRO:
The available excess nutrients in the ocean is huge (equivalent to a storage of 2000 Gt C).
Personal communication, 7/4/2008.
Note: the above article (with fewer diagrams) was submitted as a Letter to Nature on 26 July 2008 and was rejected without peer-review.